The euphoria in the cryptocurrency market was quelled on Jan.11 as the majority of altcoins saw their prices decline by more than 20% as Bitcoin price sold off sharply.
After falling below the $40,000 support level on Jan. 10, selling pressure for Bitcoin (BTC) increased overnight and pushed the price of the top cryptocurrency as low as $30,229 before a soft support level was reached.
The rapid decline in price led to more than $2.7 billion worth of futures contracts being liquidated and the long candles on the Bitcoin price chart show that the cascade of liquidations occurred quickly as the price dropped from $41,000 to $32,229.
Dallas Mavericks owner Mark Cuban used the market downturn as no opportunity to point out that the cryptocurrency market is identical to the internet stock bubble from the 1990s.
Cuban said that “Watching the cryptos trade, it’s exaclty like the internet stock bubble,” but he added that Bitcoin, Ether, and “a few others” will likely follow the path of Amazon and eBay and continue to see their valuations rise.
Those with a little more skin in the game, such as Celsius CEO Alex Mashinsky, view the recent drop as a healthy price correction and Mashinsky hinted that there is a possibility of BTC dropping as low as $16,000 before resuming its upward trek.
Traditional markets feel the pressure
The traditional financial sector also found itself under pressure on Monday as the political situation in the United States continues to generate tension and uncertainty about the future of the country and the economy.
The S&P 500, Dow, and the NASDAQ all finished the day in the red, down 0.66%, 0.29%, and 1.55% respectively as big-tech and the FAANG stocks hit their lowest levels since Nov. 26.
Analysts say the market was due for a correction
Nearly every time BTC price falls by thousands of dollars, bears, doomers and nocoiners emerge from the netherscape to issue calls for the death of Bitcoin.
Considering that Bitcoin price rose from $17,586 on Dec. 11 to $41,950 in less than a month, David Lifchitz, CIO at ExoAlpha views this pullback as a “healthy correction by smart institutions who bought BTC from $20,000 on the way up to $30,000.”
Lifchitz told Cointelegraph:
“One worrying sign was not that Bitcoin price was rising, but its velocity, i.e. the speed at which it did move. From mid-December to end of December 2020, the median amplitude of the daily moves in Bitcoin doubled to 8.1%, then it almost doubled again from Jan.1st, 2021 to Jan.10th to 15.3%. The larger the amplitude, the more exchanges took place through the day between buyers and sellers. This is a healthy correction though to purge the excessive growth of the last 10 days, allowing Bitcoin to build a new base toward $50k and above.”
Hints at the driving force behind recent price movements could also be found through analyzing patterns emerging on social media.
According to Joshua Frank, CEO and founder of TheTie, an alternative data social analytics platform, the lack of Bitcoin Twitter mentions in December 2020 indicates that a small number of large investors were driving the price gains.
In private comments to Cointelegraph Frank said:
“On January third, both Bitcoin and crypto 24-hour tweet volume hit an all-time high. Retail interest has continued through the second week of January and monthly average Twitter conversations around Bitcoin are now at an all-time high in January. Unsurprisingly, this surge in Twitter activity has corresponded with a local top on Bitcoin.”
Ether (ETH) price was also hard hit by today’s downturn, dropping as low as $914 before finding support. At the time of writing, ETH is down 16.33% and trading at $1,033. Out of the top 50 cryptocurrency projects, the only token currently trading in the green on the day is Neo (NEO), up 1.5% and trading at $22.52.
The overall cryptocurrency market cap now stands at $847 billion and Bitcoin’s dominance rate is 68.9%.
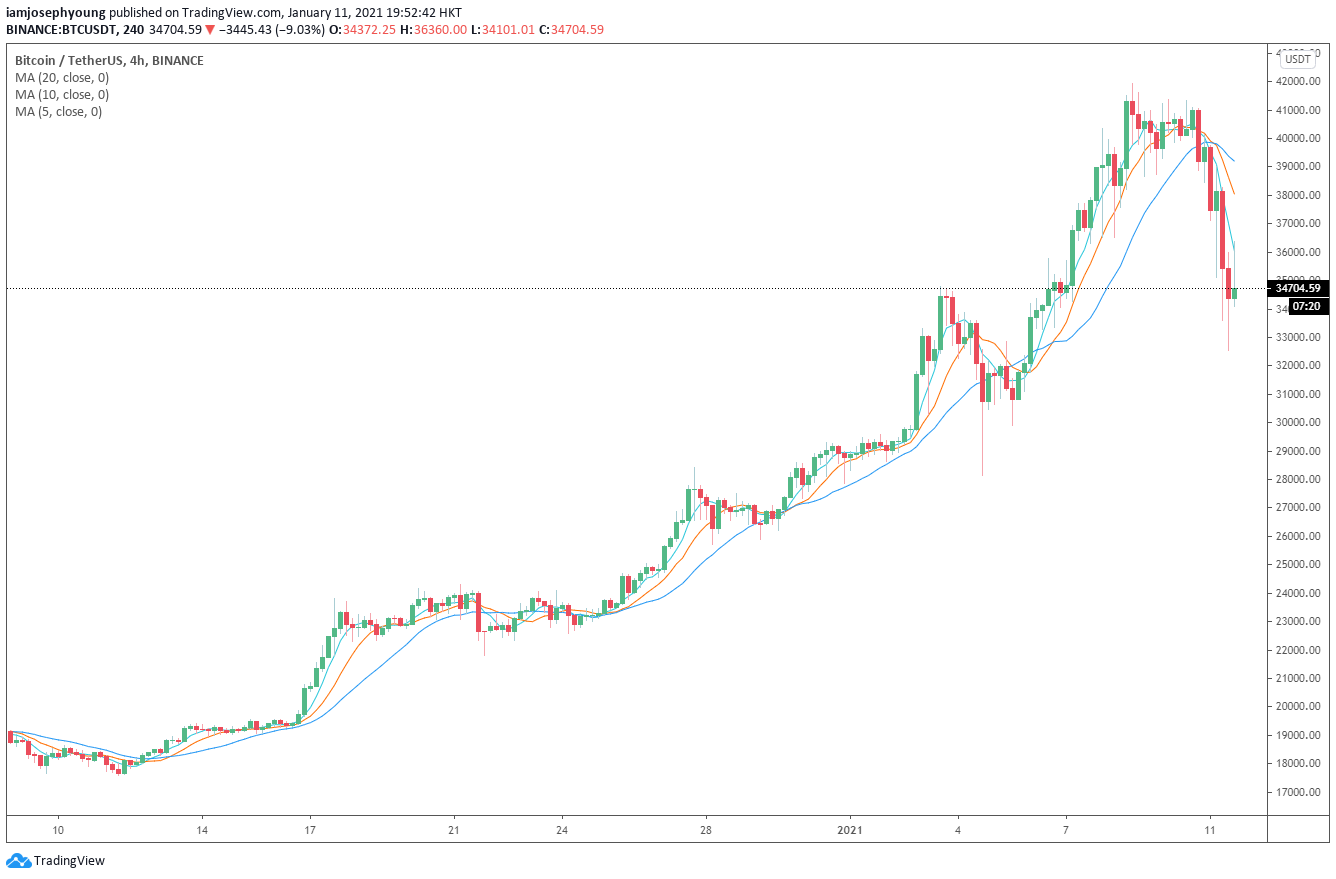
After Bitcoin (BTC) price flirted with a $42,000 all-time high on Jan. 8, it stabilized in a tightening range between $39,000 to $41,500 for two days and the pennant structure on the shorter-term timeframes hinted that a breakout to $45,000 was a possibility.
This all changed quite suddenly Jan. 10 as the $39,000 support failed to hold and Bitcoin price entered a steep correction.
BTC/USD 4-hour chart. Source: TradingView
A swirling and cruel 26.6% drop took BTC down to $30,100 over the next 30 hours and $1.5 billion in cascading liquidations at derivatives exchanges boosted the correction. Interestingly, this occurred just as the open interest on BTC futures reached a $12.7 billion all-time high.
Derivatives exchanges BTC futures open interest in USD. Source: Bybt.com
Today’s price action presents a story of doom, gloom and liquidations, but what it fails to mention is that the Bitcoin price crashed by 20.4% just one week ago as it tested sub $28,000 levels.
During that similar price event, a total of $1.2 billion in long contracts were liquidated, so the price action of today isn’t so different from what the market experienced just a week ago on Jan. 11.
BTC/USD 4-hour chart. Source: TradingView
As the chart above shows, BTC bounced back by 11% one hour after dropping below the $28,000 level. What might have surprised traders this time around is the 13% bounce from $32,200 to $36,400 which created a false bottom.
To understand if that’s the case, one should analyze crypto exchanges’ top traders long-to-short ratio and hourly liquidations.
OKEx top traders bought the top
Exchange-provided data highlights traders’ long-to-short net positioning. By analyzing every client’s position on the spot, perpetual and futures contracts, one can obtain a clearer view of whether professional traders are leaning bullish or bearish.
With this said, there are occasional discrepancies in the methodologies between different exchanges, so viewers should monitor changes instead of absolute figures.
Top traders BTC long/short ratio. Source: Bybt.com
The top traders at Binance averaged a 23% position that favored longs over the past 30 days. This wasn’t the case on Jan. 7, when they started adding long positions until reaching a 59% peak in the early hours of Jan. 10.
This move took place as BTC broke the $37,000 resistance and paved its way to $41,500. Therefore, Binance top traders have been mostly reacting after each BTC price move instead of trying to anticipate it.
On the other hand, top traders at Huobi averaged a 0.91 long-to-short ratio over the last 30 days, thus favoring net shorts by 9%. From Jan. 8 to the early hours of Jan. 10, these traders had been increasing their shorts, hence profit-taking as BTC failed to break the $42,000 level.
This trend reverted as BTC lost the $39,000 support, and Huobi’s top traders reduced their 28% net short to 4% in an attempt to catch the bottom.
Lastly, OKEx top traders have been adding long positions, driving the indicator from 1.00 (flat) in the early hours of Jan. 8 to a 1.79 ratio favoring longs in the early hours of Jan. 11.
These traders bought the top and were the ones who were heavily liquidated as the BTC price crashed by 26%. Their long to short ratio hit 1.00 (flat) again just as BTC hit $34,000 on Jan. 11.
Bitfinex traders were also caught by surprise
Bitfinex gathers weekly data on top traders’ profit and loss, although it is possible for users to ‘opt-out’ from this ranking. Over the past 24 hours, the bottom 10 lost a combined $153.3 million.
Bitfinex top traders weekly profit & loss. Source: Bitfinex
Relevant losses during a surprise crash should not mean that Bitfinex traders got it all wrong. Some traders might have been ill-positioned, but overall they have been profit-taking during the rally. As of now, Bitfinex traders are back to a ‘neutral’ position according to its historical levels.
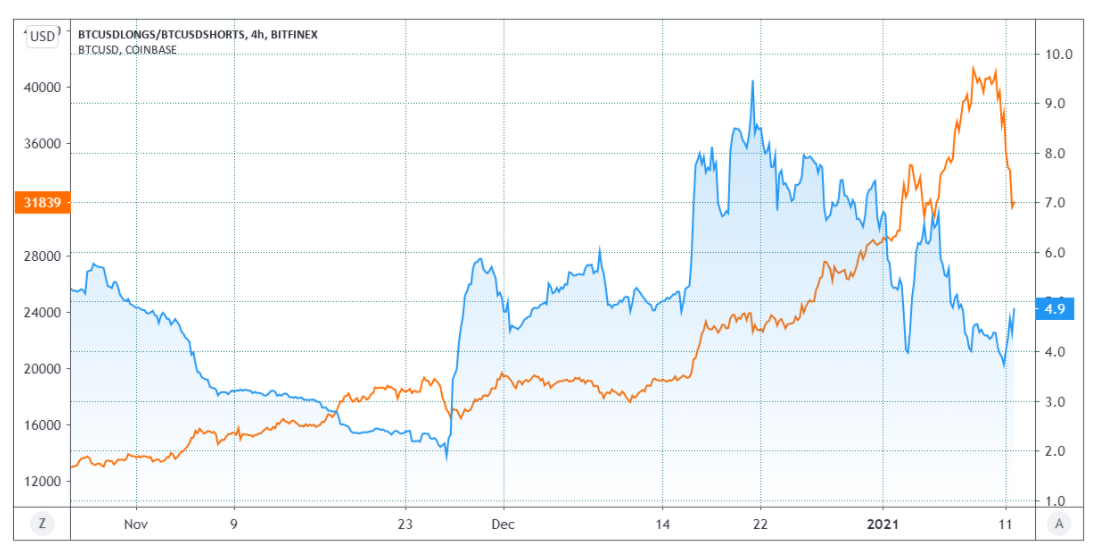
Bitfinex BTC long to short ratio (blue) vs BTC price (orange). Source: Bitfinex
Exchange-provided data shows that Bitfinex’s long-to-short ratio increased from 2 to 9, favoring longs between Nov. 25 and Dec. 21.
To put things in perspective, its 6-month moving average stands at 6, leaning toward longs. Thus, considering its leverage data from margin products, these traders have been surprisingly profitable.
20% of crashes are the norm rather than exception
It’s also important to consider that Bitcoin holds a 3.75% daily average volatility. Therefore, these large corrections should be expected.
Bitcoin faced a 50% intraday decline on Mar. 12, 2020, yet for those patient enough to hold through those bearish periods, an 11x rally followed as the cryptocurrency hiked from $3,600 to almost $42,000.
The views and opinions expressed here are solely those of the author and do not necessarily reflect the views of Cointelegraph. Every investment and trading move involves risk. You should conduct your own research when making a decision.
After an incredible run-up to nearly $42,000, Bitcoin (BTC) price finally entered a significant correction, and at the time of writing the price is down by about 18%. While the swift drop to $30,402 may not induce sleepless nights from the HODLer crowd, large drops like the one seen over the past 24-hours can easily blow up a leveraged trader’s portfolio. The sharp downside move also threatens to wipe out a large portion of the gains accrued over the past few weeks.
Data from Bybt indicates that over $2.7 billion worth of futures contracts has been squared off in the past 24 hours.
Once traders in long positions start getting liquidated due to margin calls, traders who have been waiting to buy withhold their purchases as they expect an even better opportunity to buy at a bargain. This lack of demand and excess supply trigger steep falls like the one seen today.
Similar to how resistance levels fail to stall a rally backed by strong momentum, during panic selling, support levels fail to arrest the decline. Professional traders usually do not step in to catch a falling knife. They prefer to wait for the excess froth to clear and the selling to subside before jumping in to buy.
Let’s study the charts of the top-10 cryptocurrencies to identify the levels that may act as strong support.
BTC/USD
Bitcoin dipped to an intraday low at $35,111.58 on Jan. 10 but the price recovered sharply and closed at $38,161.04. However, the bears were in no mood to relent as they again sold aggressively.
The BTC/USD pair broke below the critical support at the 20-day exponential moving average ($32,093) but found support at $29,688.10 near the 38.2% Fibonacci retracement level.
If the rebound off $29,688.10 sustains, it will be considered as a normal correction after an extended bull run. The bulls will then again attempt to resume the uptrend.
On the contrary, if the bears sink the price below $29,688.10, the next support is at the 50% retracement level at $25,897.42, placed just above the 50-day simple moving average at $24,307.
A deep fall to this level will suggest that the upside momentum has broken and the pair may chalk out a new trend.
ETH/USD
Ether (ETH) made a long-legged Doji candlestick on Jan. 10 and that was followed by a sharp fall today, which suggests aggressive profit booking by the traders. The bulls are currently trying to defend the 20-day EMA ($956).
If they succeed, the ETH/USD pair may rise to $1,100 where the bears may again step in and sell the relief rally. If the price turns down from this resistance but the bulls do not allow the price to dip below the 20-day EMA, it could result in a consolidation for a few days.
On the contrary, if the bears sink the price below the 20-day EMA, the next stop is $840.93 and if this support also cracks, the decline may extend to the 50-day SMA at $712. The deeper the fall, the longer it will take for the bulls to stage a recovery.
XRP/USD
XRP could not rise above the overhead resistance at $0.384998, which suggests that traders lightened their positions on relief rallies. The altcoin broke below the 20-day EMA ($0.30) today after staying above it for the past three days.
The XRP/USD pair could now drop to the support at $0.169 where the buyers are likely to step in. A strong rebound of this support will indicate that the pair may remain range-bound between $0.169 and $0.384998 for a few more days.
Contrary to this assumption, if the bears sink and sustain the price below $0.169, the downtrend could resume with the next stop at $0.10.
LTC/USD
After struggling to break out and sustain above $180 for the past few days, Litecoin (LTC) succumbed to an aggressive bout of profit-booking today. The altcoin plunged below the 20-day EMA ($142) and is currently attempting to stay above the $120 support.
If the LTC/USD pair rebounds off the current levels, the bulls may attempt to resume the uptrend but any rise is likely to face aggressive selling at the 20-day EMA. If the bulls push the price above the 20-day EMA, the pair may try to gradually move up to $160.
If the price turns down from the 20-day EMA, the bears will try to sink the price below the 50-day SMA ($108). If they succeed, the pair may drop to $100 and such a move will suggest a change in trend.
BCH/USD
Bitcoin Cash (BCH) soared above the $515.35 overhead resistance on Jan. 9 and followed that up with another strong rally on Jan. 10, which pushed the price to $631.71, just below the $640 target objective suggested in previous analysis.
Aggressive profit-booking pulled the price back below the $515.35 level today, which is a negative sign as it shows the bulls could not flip $515.35 into support. The BCH/USD pair has completed a 100% retracement of the rally that started on Jan.9.
The pair may now consolidate between $515.35 and $370. If the bears sink the price below the $370 to $353 support, the pair may decline to $250. For the bulls to regain strength, they will have to push and sustain the price above $515.35.
ADA/USD
Cardano (ADA) broke below the 20-day EMA ($0.236) today, which is just below the 61.8% Fibonacci retracement level at $0.2395088. However, the long tail on the day’s candlestick suggests that the bulls are attempting to defend this level.
If the ADA/USD pair sustains the rebound, the bulls will again try to resume the uptrend. The first level to watch on the upside is $0.28. If the bulls can drive the price above this resistance, the pair may rise to $0.34.
Contrary to this assumption, if the current rebound fails to sustain or if the price turns down from $0.28, the bears will try to sink the pair below the 20-day EMA. If they succeed, a drop to the 50-day SMA at $0.18 could be on the cards.
DOT/USD
Polkadot (DOT) bounced off the 38.2% Fibonacci retracement level at $8.5515 on Jan. 10 but the bulls could not capitalize on the recovery, which indicates a lack of demand at higher levels.
This could have attracted selling by short-term traders, which pulled the price down to the 61.8% Fibonacci retracement level at $7.2365 today. If the bulls flip the $6.8619 level to support, the DOT/USD pair may attempt to resume the uptrend.
The relief rally could face selling at the 20-day EMA ($8.16) but if this resistance is surmounted, the pair may again move up to $10.68. A trend change is likely in order if the bears sink the price below $6.8619.
LINK/USD
Chainlink (LINK) failed to sustain above the $17.7777 overhead resistance on Jan. 10, which could have attracted profit-booking from short-term traders. The selling intensified today and that has pulled the price down to the 50-day SMA at $13.31.
If the price sustains below the 50-day SMA, the LINK/USD pair could drop to the uptrend line. This is an important support to watch out for because if it cracks, the decline could extend to $8.
Conversely, if the pair rebounds off the current levels or from the uptrend line, the bulls will try to push the price above the 20-day EMA ($14). If they succeed, the price may rise to $15 and then to $17.7777.
BNB/USD
The long tail on Dec. 10 candlestick suggests the bulls aggressively purchased the dip to 40 but they failed to build upon the recovery today. The bears resumed their selling and have dragged Binance Coin (BNB) below the 20-day EMA ($38.53).
The bulls are currently attempting to defend the $35.69 support. If they succeed, the BNB/USD pair may attempt a rebound that is likely to face stiff resistance at the 20-day EMA.
If the price turns down from the 20-day EMA, the bears may attempt to sink the price to the 50-day SMA ($33.40) and then to $32. Such a move will suggest that the pair may have topped out for the short-term.
However, if the price rebounds off the current levels and rises above the 20-day EMA within the next few days, it will suggest strong demand at lower levels and the bulls may try to resume the uptrend.
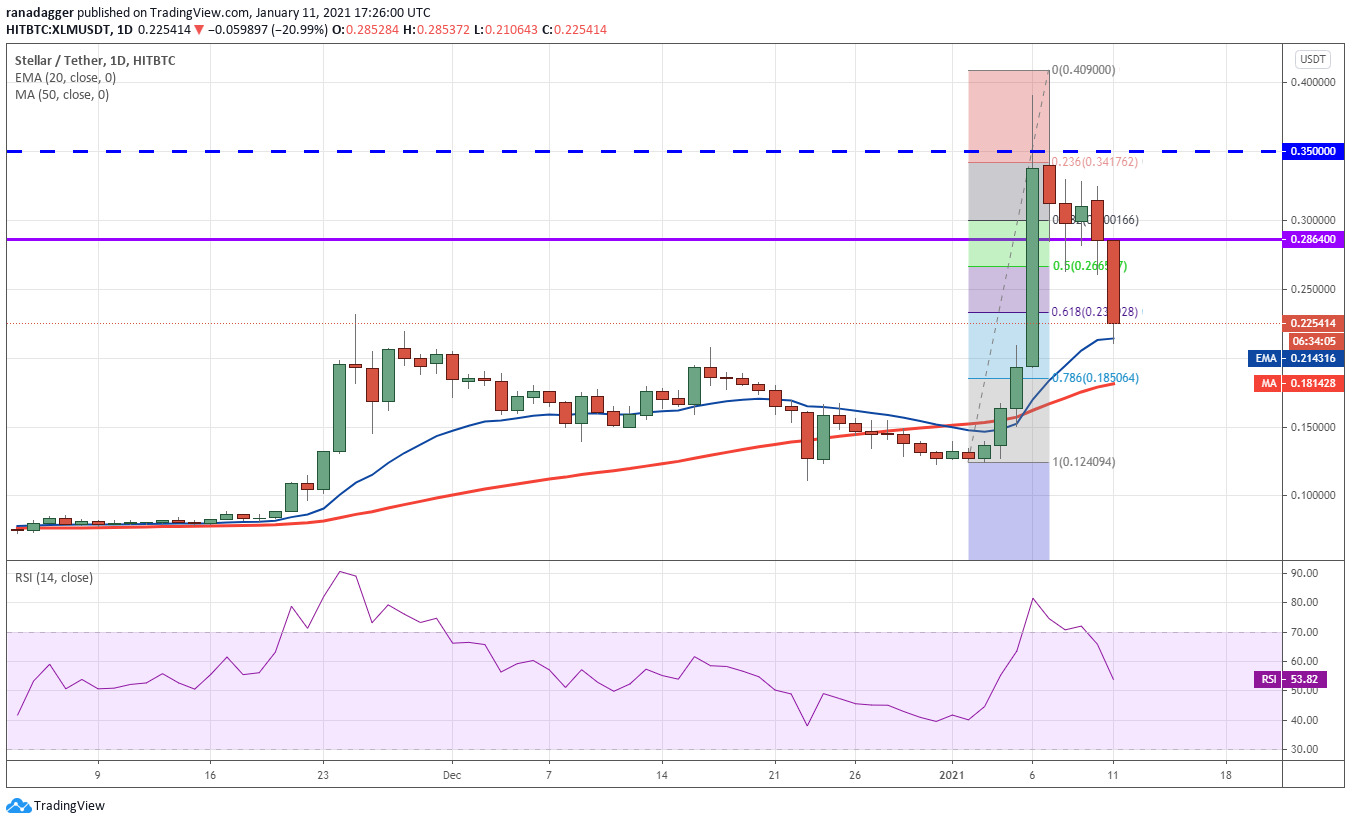
XLM/USD
The bulls defended the $0.2864 level for the past four days but the failure to achieve a strong rebound showed a lack of demand at higher levels. Stellar Lumens (XLM) broke below $0.2864 and the 61.8% Fibonacci retracement level at $0.232928 today.
The bulls are currently attempting to defend the 20-day EMA ($0.214). If they succeed, the XLM/USD pair may attempt to move up to $0.2864. This is likely to act as a stiff resistance but if the bulls can push the price above it, a move to $0.35 is likely.
Contrary to this assumption, if the bears sink the price below the 20-day EMA, it will suggest traders are not buying the dip, indicating the rally on Jan. 6 was a bull trap.
The views and opinions expressed here are solely those of the author and do not necessarily reflect the views of Cointelegraph. Every investment and trading move involves risk. You should conduct your own research when making a decision.
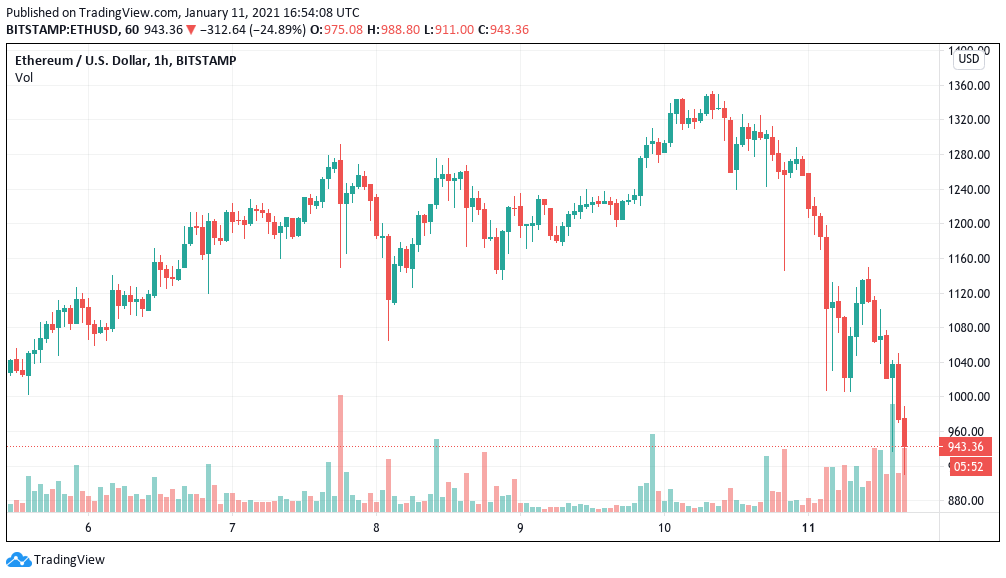
The past week has been an emotional rollercoaster for Ether (ETH) traders, as there were seven four-hour candles of a 10% or larger price movement.
Furthermore, the most recent 30% drop to $920 triggered $550 million in liquidations on long futures contracts. To complicate things even further, this current price correction is taking place just four weeks ahead of the launch of CME’s ETH futures.
ETH/USD 4-hour chart. Source: TradingView
It’s possible that even the most bullish Ether traders did not expect an 85% rally to occur in just eight days. During that short timespan, the top-ranked altcoin blasted through the $800 resistance and quickly climbed to $1,350, which is only 5% below its all-time high.
In 2017, Ether’s swift climb to $1,400 was primarily backed by the initial coin offering boom, but this time a different set of factors drove Ether’s price higher. Many DeFi platforms rely on the Ethereum network, and Ether is the most common asset used as the gateway to these platforms. Aside from increased activity on the Ethereum network, the increased use has also resulted in high transaction fees.
At the moment, there is not much negative news flow coming from the Ethereum camp or major media outlets. Data shows that Ether’s fundamentals are still strong, and investors are content to wait for further Eth2 network developments.
To understand whether the recent crash reflects a potential local top, investors should gauge the network use metrics on the Ethereum network. A great place to start is analyzing transactions and transfer value.
ETH/USD price vs. transactions and transfers. Source: DigitalAssetsData
The chart above shows the indicator spiking above $8 billion in daily transactions, a 200% increase compared with the previous month’s $2.6 billion average. This noticeable hike in transaction and transfer value signals strength and suggests that Ether’s price is sustainable above $1,000.
Exchange withdrawals point to whale accumulation
Increasing withdrawals from exchanges can be caused by multiple factors, including staking, yield farming and buyers sending coins to cold storage. Usually, a steady flow of net deposits indicates a willingness to sell in the shortterm. On the other hand, net withdrawals are generally related to periods of whale accumulation.
ETH/USD price (right) vs. exchanges net ETH flow (left). Source: CryptoQuant
From Jan. 4 to Jan. 11, exchanges faced net withdrawals of 460,000 ETH. This move signals a potential accumulation from whales either transferring to cold wallets or putting these coins into the DeFi ecosystem.
This move contradicts the usual expectation that large holders rush to deposit on exchanges as Ether approaches its all-time high. Apart from a 100,000 ETH net deposit on Jan. 10, the net withdrawal trend has prevailed since December 2020.
The futures premium is still unusually high
Professional traders tend to dominate longer-term futures contracts with set expiry dates. By measuring the expense gap between futures and the regular spot market, a trader can gauge the level of bullishness in the market.
The three-month futures should usually trade with a 1.5% or higher premium versus regular spot exchanges. Whenever this indicator fades or turns negative, this is an alarming red flag. This situation is known as backwardation and indicates that the market is turning bearish.
March 2021 ETH futures premium. Source: Digital Assets Data
The above chart shows that the indicator has been ranging from 3.5% to 6%, which translates as moderately bullish. The current 4.5% rate is equal to a 19% annualized premium and is significantly above the 6% neutral threshold. This shows that despite the recent $1,000 dip, professional traders are still confident in Ether’s price potential.
Spot volume remains strong
In addition to monitoring futures contracts, profitable traders also track volume in the spot market. Typically, low volumes indicate a lack of confidence. Therefore, significant price changes should be accompanied by robust trading activity.
ETH aggregate spot exchanges volumes. Source: Coinalyze.net
Last week, Ether averaged an impressive $6.7 billion in trading volume, a noticeable increase from the levels seen in previous weeks. Despite the current drop, trading activity surrounding the recent price peak is a positive indicator.
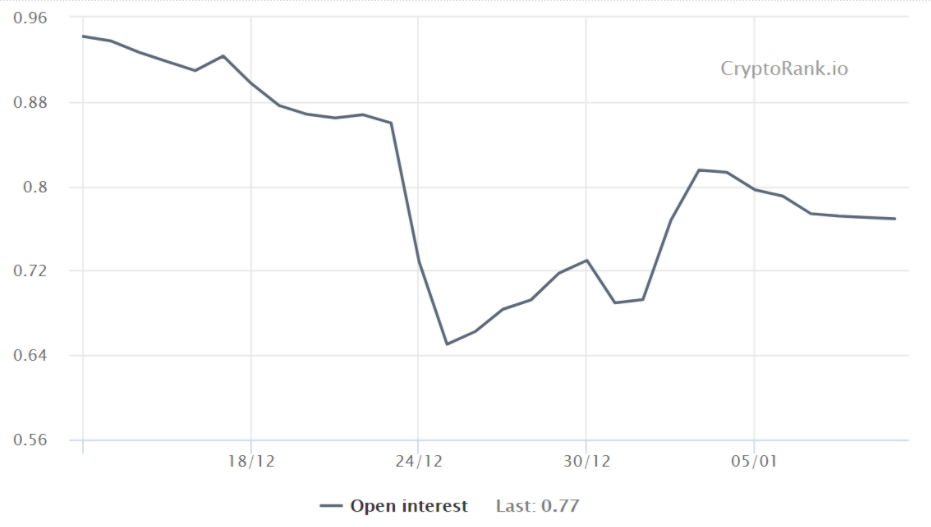
Options put/call ratio
By measuring whether more activity is going through call (buy) options or put (sell) options, one can gauge the overall market sentiment. Generally speaking, call options are used for bullish strategies, whereas put options are used for bearish ones.
A 0.70 put-to-call ratio indicates that put options open interest lags the more bullish calls by 30% and is therefore bullish.
ETH options put-to-call ratio. Source: Cryptorank.io
At the moment, there is no sign that investors have flipped to more neutral-to-bearish (put option) strategies, as the indicator stands at 0.77 and favors call options. This trend has also prevailed over the past week as investors continue to open new bullish positions.
This data is very encouraging, considering that Ether rallied 38% from Jan. 4 until reaching its $1,350 peak. Nevertheless, it is essential to monitor how today’s sharp correction will affect these bullish signs in the future.
Like Bitcoin (BTC), Ether continues to show positive fundamentals, even during the current sell-off, and this suggests that there is a good chance that the uptrend has not been broken.
The views and opinions expressed here are solely those of the author and do not necessarily reflect the views of Cointelegraph. Every investment and trading move involves risk. You should conduct your own research when making a decision.
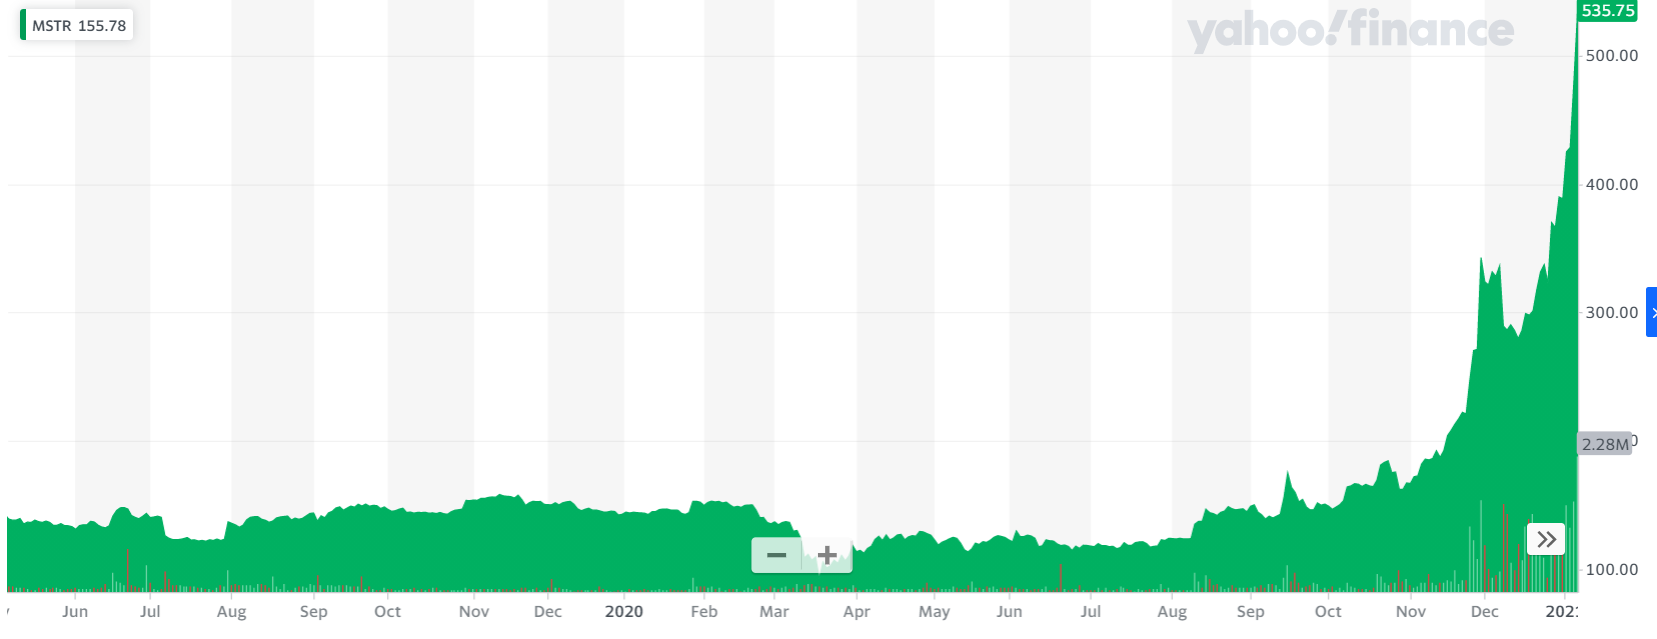
Shares of MicroStrategy (MSTR), a business intelligence firm with considerable exposure to Bitcoin (BTC), declined sharply on Monday, as profit-taking ensued following a parabolic rally over the past month.
The stock touched an intraday low of $464.51 in New York trading, representing a decline of almost 13%. It would later pare losses to trade around $500 a share. At current values, the company has a total market capitalization of around $4.6 billion. Last week, the stock peaked just below $512, marking a new all-time high.
MSRT went parabolic after CEO Michael Saylor decided to buy Bitcoin. Source: Yahoo Finance
The broader equity market was also under pressure on Monday, with the S&P 500 Index and tech-heavy Nasdaq each falling more than half a percent.
MicroStrategy is the world’s largest corporate holder of Bitcoin, with 70,470 BTC on its books as of Monday, according to industry data.
The firm has been buying up the digital asset on the belief that Bitcoin represents a “dependable store of value and an attractive investment asset with more long-term appreciation potential than holding cash.”
Despite its dramatic appreciation over the past few months, Bitcoin remains a highly volatile asset. At the time of writing, BTC was just under $32,000, having declined 20% over the past 24 hours.
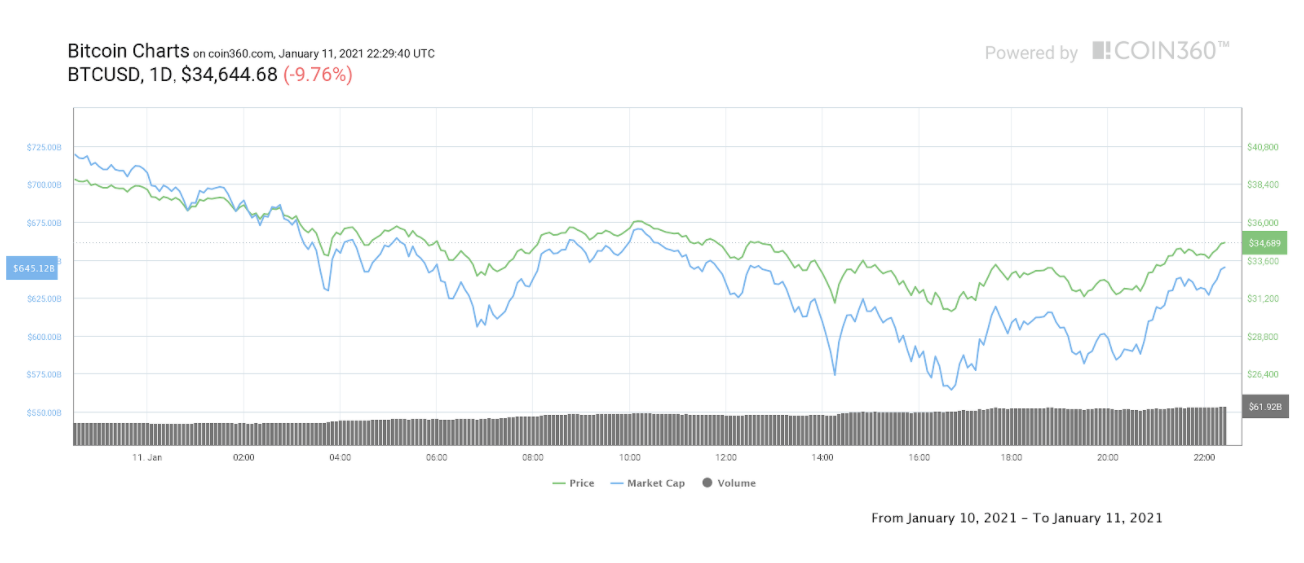
Bitcoin (BTC) hodlers got a serious test of their resolve on Jan. 11 as the largest cryptocurrency approached $30,000.
Cryptocurrency market overview on Jan 11, 2021. Source: Coin360
BTC price hits $30,250
Data from Cointelegraph Markets, Coin360 and TradingView showed BTC/USD continuing its bearish streak after Wall Street opened on Monday, taking 24-hour losses to 23%.
The move extends a reset of the market that kicked in over the weekend after Bitcoin hit all-time highs of $42,000.
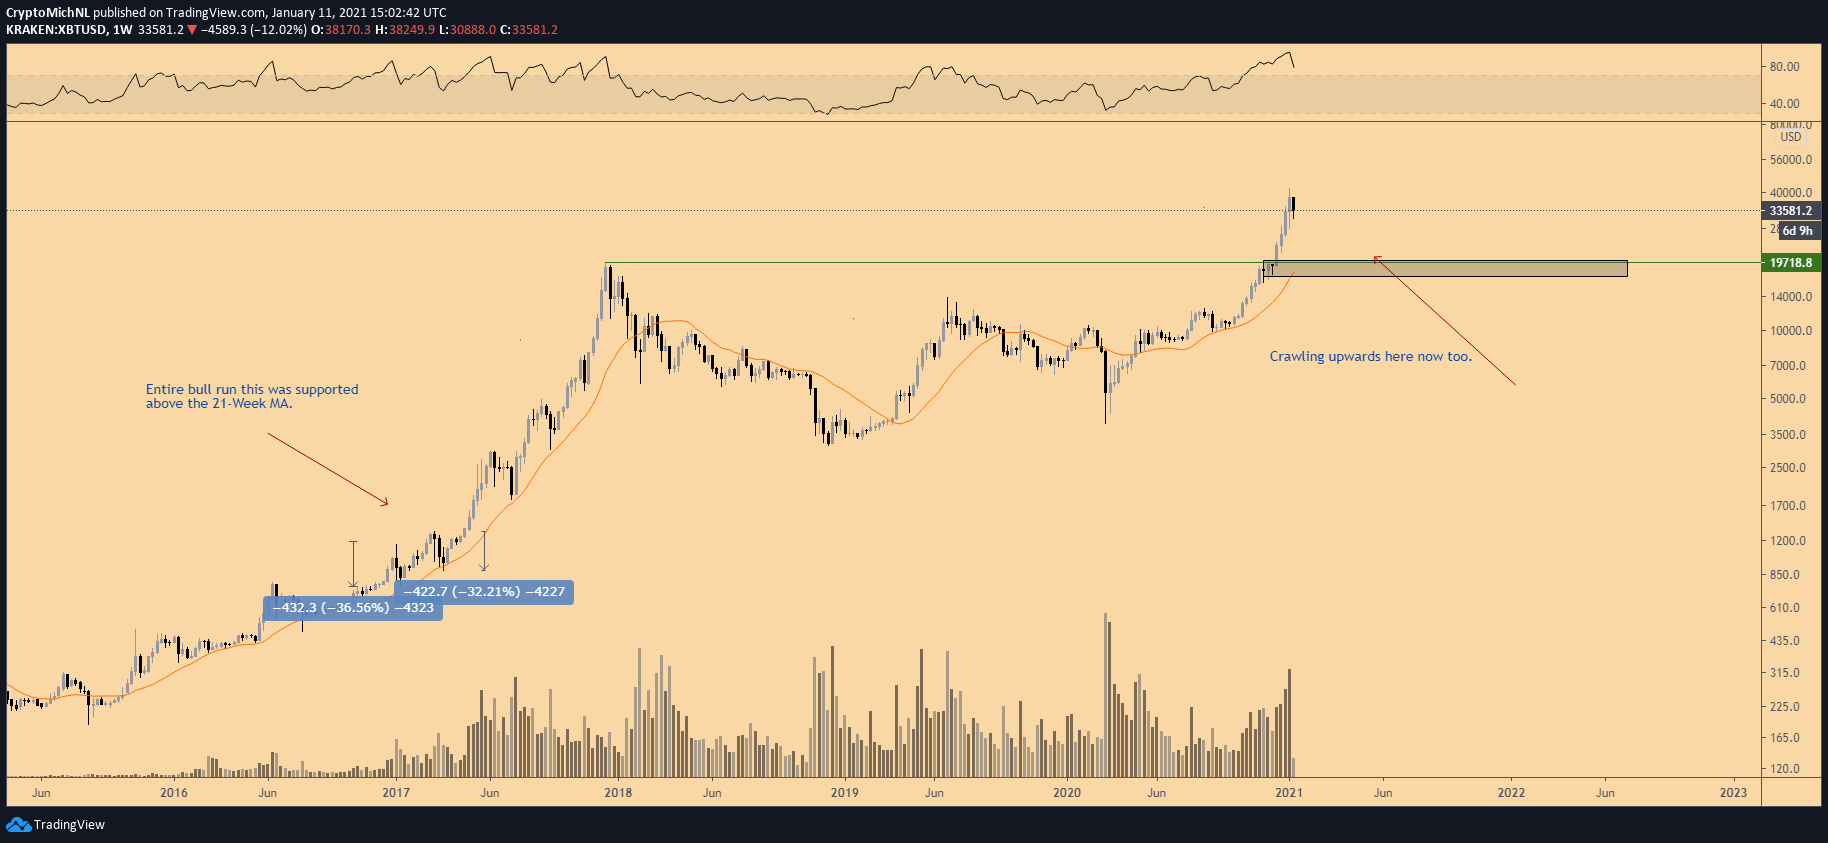
BTC/USD 1-day candle chart with 21-week moving average (Bitstamp). Source: TradingView
A slow comedown accelerated through Sunday, with Monday continuing the selling pressure with little respite for traders attempting to “buy the dip.”
While traders were hardly panicked by what remains standard behavior for Bitcoin, prognoses began to favor a break from the kind of parabolic action of recent days and weeks.
For Cointelegraph Markets analyst Michaël van de Poppe, a useful reference for defining a mid-term floor lies in Bitcoin’s 21-week moving average (MA). Currently at $18,000, the indicator will be rising to match previous price growth while the price itself may continue to fall, with the two meeting in the middle of the resulting range to form a bottom.
“If you’d ask me a scenario for #Bitcoin, I think we’ll see something like this in which the 21-Week MA comes in to play as support too,” he tweeted on Monday.
“Altcoins to do really well from the bottom.”
Spotlight on miner profit-taking
As Cointelegraph reported, the run above $40,000 may have incentivized miners to pause for profit-taking, with data showing that sales had reached their highest since July 2019. In addition, concerns revolved around the market being overleveraged after such rapid gains.
“Long positions had gotten very large, and so prudent risk management dictated that long holders, including miners, take a little off the table,” Chad Steinglass, head of trading at exchange CrossTower told Cointelegraph in private comments.
“The fact that this action occurred over the weekend, when traditional asset players were off from work, and when potential new inflows of cash from new investors were not yet hitting institutional players accounts, lead to order flow shifting to be unbalanced, this time sellers dominating.”
Steinglass added that the status quo may naturally shift in bulls’ favor as the trading week gets underway.
“It remains to be seen whether the start of the work week in the US and the opening of traditional banking hours will bring with it enough support from inflows to balance or overcome the sell interest or not,” he concluded.
Guy Hirsch, managing director for the U.S. at trading platform eToro, agreed.
“Bitcoin is trading down largely as a result of profit taking. Since we are still so far above the all-time high set before this recent bullish run up, it remains to be seen how much further we can fall,” he told Cointelegraph.
“Though we don’t anticipate this, a fall below $20,000 could be a bad omen for the conviction institutions have behind their Bitcoin allocations, since they largely stepped in around the $20,000 price level.”
In line with van de Poppe’s comments, altcoins were wary at publication time, with many of the top 10 cryptocurrencies by market capitalization seeing 20% losses on the day. Ether (ETH), the largest altcoin, quickly lost the $1,000 support to trade at $950.
Renewed strength in the U.S. dollar, meanwhile, could also keep Bitcoin in check, van de Poppe added in analysis on Monday.
Bitcoin price has been accelerating massively in recent months, with Bitcoin (BTC) rallying from $10,000 to $41,500. This rally went vertical without any major corrections in between.
However, every upward cycle has its standard 30% corrections, which can even be considered healthy for more upside.
Bitcoin’s price started to fall south in the past days as it dropped 25% to $30,000. This dropdown was also influenced by the U.S. dollar’s sudden surge, which might be bottomed out in the short term.
A trend reversal starts with lower time frames flipping bearish, and this chart is an example of such a trend reversal. The $38,900 support was lost after multiple tests.
That’s not bad in itself. But when the support level flips bearish into a resistance, that’s likely to trigger continuation downward.
A similar support/resistance flip occurred at the $36,300 area, after which the price accelerated downward to the support areas at $32,500 and $30,000. Traders and investors should remember that downward corrections almost always occur in a fast and painful move.
However, support seems to be found at $30,000, which can induce some range-bound constructions for now. Such a range-bound construction is healthy for the markets, as strength can be built for the next impulse wave. This impulse wave will most likely occur at a later stage in 2021.
Fibonacci confluences with the current support levels
The 3-day chart shows confluences on the levels of interest for Bitcoin investors. In general, the previous all-time high at $20,000 would be a tremendous gift to the entire market. However, above this last all-time high, other levels are found and will likely be formidable support.
These levels are aligned with the Fibonacci indicator. The first significant level of support is found in the region between $29,500 and $30,500. This is the level where Bitcoin’s price is currently finding support.
From here, a relief bounce toward $35,000 to $37,000 could occur before another final dip starts.
That final dip could be toward the region around $25,000 to $26,000, as that’s the next Fibonacci level.
Dollar bouncing signaling weakness across markets
U.S. Dollar Currency Index (DXY) 1-day chart. Source: TradingView
One of the primary variables for this recent correction across the crypto and equity markets is the strengthening of the U.S. dollar. The dollar strength index (DXY) landed on a significant support level and marked a temporary low with a daily bullish divergence.
Since then, the dollar has been rallying upward, causing other inversely correlated markets to drop south.
The first area of resistance is constructed around the 92-points level. This area of resistance would automatically mean that other markets could correct further.
The ultimate level to watch for Bitcoin traders is the weekly time frame, which is the 21-week moving verage. In 2016 and 2017, Bitcoin’s price rested on this moving average as support through the entire bull cycle.
It’s not unlikely to have a similar test happen in the coming months, and it would suit with the likelihood of some consolidation before continuation. However, investors shouldn’t be worried at all about the current value of the 21-week MA. It’s a lagging indicator, however, which means it’s going to crawl up in the coming weeks toward the $25,000 area.
That region would mean a correction of around 40% for the crypto markets, which is also something that has happened more than once in previous bull cycles before new highs.
The views and opinions expressed here are solely those of the author and do not necessarily reflect the views of Cointelegraph. Every investment and trading move involves risk. You should conduct your own research when making a decision.
Over $2.7 billion worth of futures contracts got liquidated in the last 24 hours, based on data from Bybt.com. This caused the price of Bitcoin (BTC) to see a large drop in a short time frame as it plunged from over $41,000 to sub-$32,600.
Why would mass liquidations cause Bitcoin to drop?
In the futures market, liquidations of positions occur because traders are borrowing additional capital to trade with larger positions.
For example, exchanges in the Bitcoin futures market typically offer up to 100x leverage. This allows traders to borrow 100 times of their initial capital to trade BTC.
The downside of leverage is that when the price of Bitcoin sees a minor drop, it can cause a position to get liquidated, or be worthless.
Liquidated long on XBTUSD: Sell 1,235,411 @ 34710.5 ~ Multi kill ~ If you can dodge a liquidation you can dodge anything
For instance, let’s say a trader uses 10x leverage and borrows 10 times of his capital to buy Bitcoin at $40,000. If the price drops 10% to $36,000, the position would get liquidated.
When a long position gets liquidated, the position is then sold to the market. Hence, if the majority of the market is longing Bitcoin and long contracts begin to get liquidated, it creates massive selling pressure.
On Jan. 11, the Bitcoin market saw a massive long squeeze triggered by large sell orders on Coinbase. As whales or high-net-worth investors sold, it caused many long contracts to get liquidated in a matter of hours.
The consecutive liquidations led to a domino effect, resulting in a steep sell-off and a 16% correction.
But, one optimistic sign is that the correction came to an end at around $32,700, which Whalemap analysts described as a whale cluster support area.
A whale cluster forms when the whales buy Bitcoin at a certain level and do not move them. This level often turns into a support area because whales are likely to double down on their entries if a major dip occurs and the price of BTC drops back to that level.
Although Bitcoin saw a large drop, the overall market sentiment around BTC remains generally optimistic.
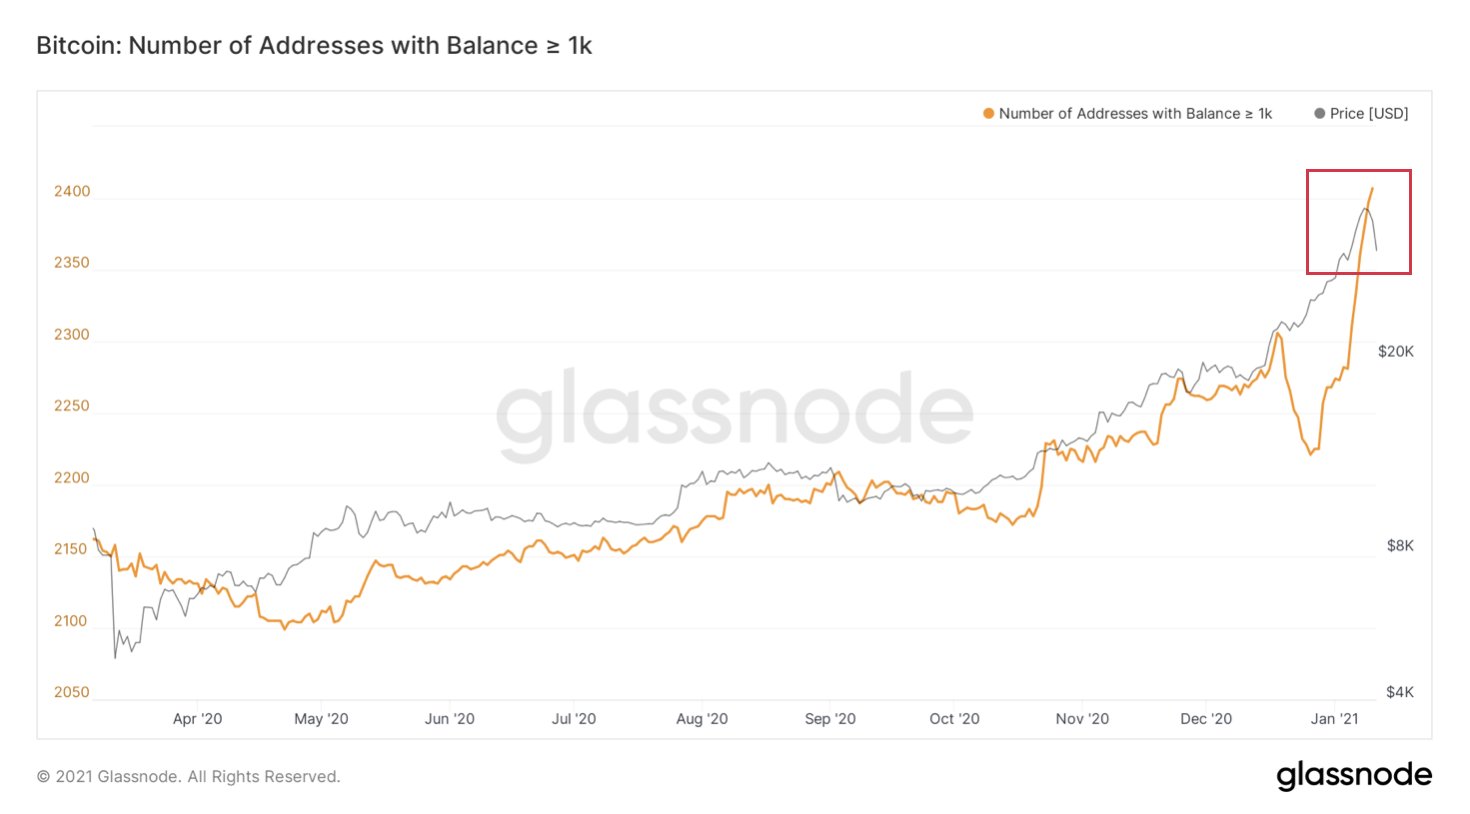
As Cointelegraph reported, Elias Simos, a protocol specialist at Bison Trails, pinpointed that the number of whales actually increased after Bitcoin saw a big price drop.
The trend shows that whales were actually accumulating as the cascade of liquidations occurred, which is positive. Simos wrote:
“Addresses with more than 1k $BTC continue growing at the expense of all others–even as this most recent downturn is taking effect. While you were selling, whales were gobbling up your Bitcoin.”
Analysts at Glassnode, an on-chain analytics firm, explained that the fundamentals of Bitcoin remain intact despite the drop. They emphasized that the Bitcoin network’s hash rate and mining difficulty are still at all-time highs. The analysts noted:
“While $BTC dipped in value today, on-chain fundamentals remain strong, pointing to a healthy network. #Bitcoin mining difficulty and hash rate are at ATHs.”
While this current 15%-25% is the biggest pullback for this bull cycle to date, it’s worth noting that numerous 30% corrections occurred during Bitcoin’s 2017 bull cycle.
As Cointelegraph reported earlier, the current BTC price pullback coincides with a potential bottom formation of the Dollar Strength Index.
Bitcoin (BTC) is changing hands fast after its drop to $32,000 and only millionaires are winning, data shows.
Statistics governing wallet balances from Glassnode on Jan. 11 reveal that the main investors “buying the dip” are those with a balance in excess of 1,000 BTC ($36 million).
“Millionaire” wallets keep growing
Compiled by Elias Simos, protocol specialist at blockchain infrastructure provider Bison Trails, the numbers suggest that the wealthy have been profiting from Bitcoin being sold by smaller investors throughout December and January.
“Addresses with more than 1k $BTC continue growing at the expense of all others–even as this most recent downturn is taking effect,” Simos summarized.
“While you were selling, whales were gobbling up your Bitcoin…”
While the number of wallets with smaller balances decreased as BTC/USD climbed from $19,000 on Dec. 1 to recent highs of $42,000, the 1,000 BTC+ group became an outlier, growing in presence.
The net effect is thus weak hands selling to strong — and the richer the entity, the stronger the hands.
“Don’t be part of the #BTC transfer to billionaires, corporations and hedge funds …. at least not yet,” entrepreneur Alistair Milne warned Twitter followers while responding to Simos’ findings.
Bitcoin entities with a balance of more than 1,000 BTC chart. Source: Glassnode
Guggenheim hints it will sell BT
While institutional buy-ins have become the standard narrative of Bitcoin over the past few months, a rogue “weak hands” signal from one of them caught analysts’ attention this week.
As Cointelegraph reported, Guggenheim Partners, which announced a sizable fund allocation to BTC in late November, is allegedly planning to sell some of its holdings already. The trigger came from CIO Scott Minerd, who on Monday said that Bitcoin’s weekend drop provides the impetus to rethink its position.
“Bitcoin’s parabolic rise is unsustainable in the near term. Vulnerable to a setback,” he wrote.
“The target technical upside of $35,000 has been exceeded. Time to take some money off the table.”
His suggestion appeared to confuse market participants, with responses querying the rationale behind the decision, coming just weeks after Guggenheim’s initial entry.
“CIO of huge firm day trading btc? It’s a 5-10yr hold minimum,” macro investor Dan Tapeiro argued.
Institutional uptake comes amid a more fundamental supply and demand squeeze for Bitcoin, with large buyers already outpacing what miners can produce each month. At the same time, miners have stepped up their sales in recent days, in what one theory suggests is some well-earned profit-taking at or near all-time highs.
Bitcoin (BTC) heads into a new week after another weekend of major volatility — but this time, the way was down, not up.
As the market loses $7,000 — the most since the “vertical” price rises began — Cointelegraph presents five things which could keep it moving in the coming days.
BTC dip makes Guggenheim want to sell
Top on the list of topics among Bitcoiners will be the cryptocurrency’s sudden fall over Saturday and Sunday.
From highs of near $42,000, BTC/USD faced a sell-off out of hours, with bears driving down the pair to current local lows of $32,300.
The drop is the most this year and since the Coronavirus caused a cross-asset crash in March 2020, but was widely predicted by analysts, who argued that Bitcoin had become overextended.
“#Bitcoin crashes >10%: The worst Bitcoin plunge since March is reminiscent of the last halving cycle in 2016/2017. The rally was followed by a slump of more than 50% in 2017,” financial commentator Holger Zschaepitz summarized in cautious words on Twitter.
In fact, a 23% drop is nothing new for long-term Bitcoin hodlers, and the lack of more significant losses suggests that even above $30,000, buyer support remains strong.
“These and upcoming dips are the opportunities you where looking for during the #FOMO feelings you had at $40,000. Use them,” Cointelegraph Markets analyst Michaël van de Poppe meanwhile continued.
At press time, Bitcoin was already rebounding, with $35,000 swiftly following the lows. This was not enough for institutional Bitcoin buyer Guggenheim, however, with CIO Scott Minerd suddenly signalling that the fund would sell some of its BTC position.
“Bitcoin’s parabolic rise is unsustainable in the near term. Vulnerable to a setback,” he claimed on Monday.
“The target technical upside of $35,000 has been exceeded. Time to take some money off the table.”
Others noted the potential bargain for large-volume buyers.
“Institutions are really shaking out all the weak hands to acquire more #Bitcoin,” David Gokhshtein, founder of Gokhshtein Media, summarized about the current status quo.
Biden talks $3 trillion money printing
In the United States, a potential bull sign for Bitcoin in the form of a massive $3 trillion stimulus program from the incoming Biden administration is being masked by a recent rebound in the strength of the dollar.
A classic inverse correlation for Bitcoin, the U.S. dollar currency index (DXY) continued its gains over recent days, heading back above the 90 mark after hitting its lowest levels since March 2018.
Last year often saw dollar weakening give Bitcoin a boost, at a time when other price relationships were steadily breaking down.
“The dollar is so extremely oversold, over-hated, and over-shorted that it all but has to rally for a while at some point soon,” Matt Maley, chief market strategist at Miller Tabak + Co., told Bloomberg.
“The dollar is getting very ripe for a tradable bounce — one that will last at least several weeks and maybe even a couple of months.”
U.S. dollar currency index 1-day candle chart. Source: TradingView
Looking to the long term, however, and it was clear for many this week that the U.S. was simply kicking its real economic hardship further down the road. Incoming president Joe Biden intends to give Americans stimulus checks worth $2,000 as part of a giant money printing exercise, which could be worth $3 trillion.
Should it pass, liquidity from the central bank will expand the most in a single instant since the Coronavirus pandemic began, and will take U.S. federal debt above $30 trillion for the first time in history.
“Time for Plan B,” Danny Scott, CEO of U.K. exchange CoinCorner, responded to the plans.
Stocks grind upwards
Equities traders are beginning to raise their hopes of incoming profits this week, thanks to the shock of recent events in the United States adding to markets’ existing gains.
On Monday, it was India’s turn in the spotlight, with stocks racing towards new all-time highs. As Cointelegraph reported, other markets are already at or near records of their own. Elsewhere in Asia and beyond, Hong Kong and South Korea made gains while Australia saw losses.
With U.S. futures down prior to Wall Street opening, a broadly mixed picture greeted market participants, with gold also struggling but oil advancing.
The extent of Bitcoin’s reliance on stock market movements is again in doubt as the weekend’s volatility looks nothing like the current macro environment. Since outperforming every major equity play except Tesla as markets rebounded from their crash last March, Bitcoin has increasingly forged its own path, unhindered by macro.
“I am expecting Bitcoin and tech stocks to double again in the next 6-9 months,” Immad Akhund, CEO of startup-focused bank Mercury, predicted over the weekend.
“It’s clear we are in an asset bubble fueled by fiscal stimulus, low interest rates and ironically higher disposable income in pandemic. Probably won’t end well but enjoy the ride on the way up!”
Akhund, like various others, added that his timeline coincided with the rollout of mass vaccination against Coronavirus, news of which has further fuelled stocks all-round rise in recent weeks.
Miners take serious profits
One explanation for the Bitcoin price drop lies firmly within the Bitcoin network itself. A classic setup, miners appear to be selling holdings at significant rates once again.
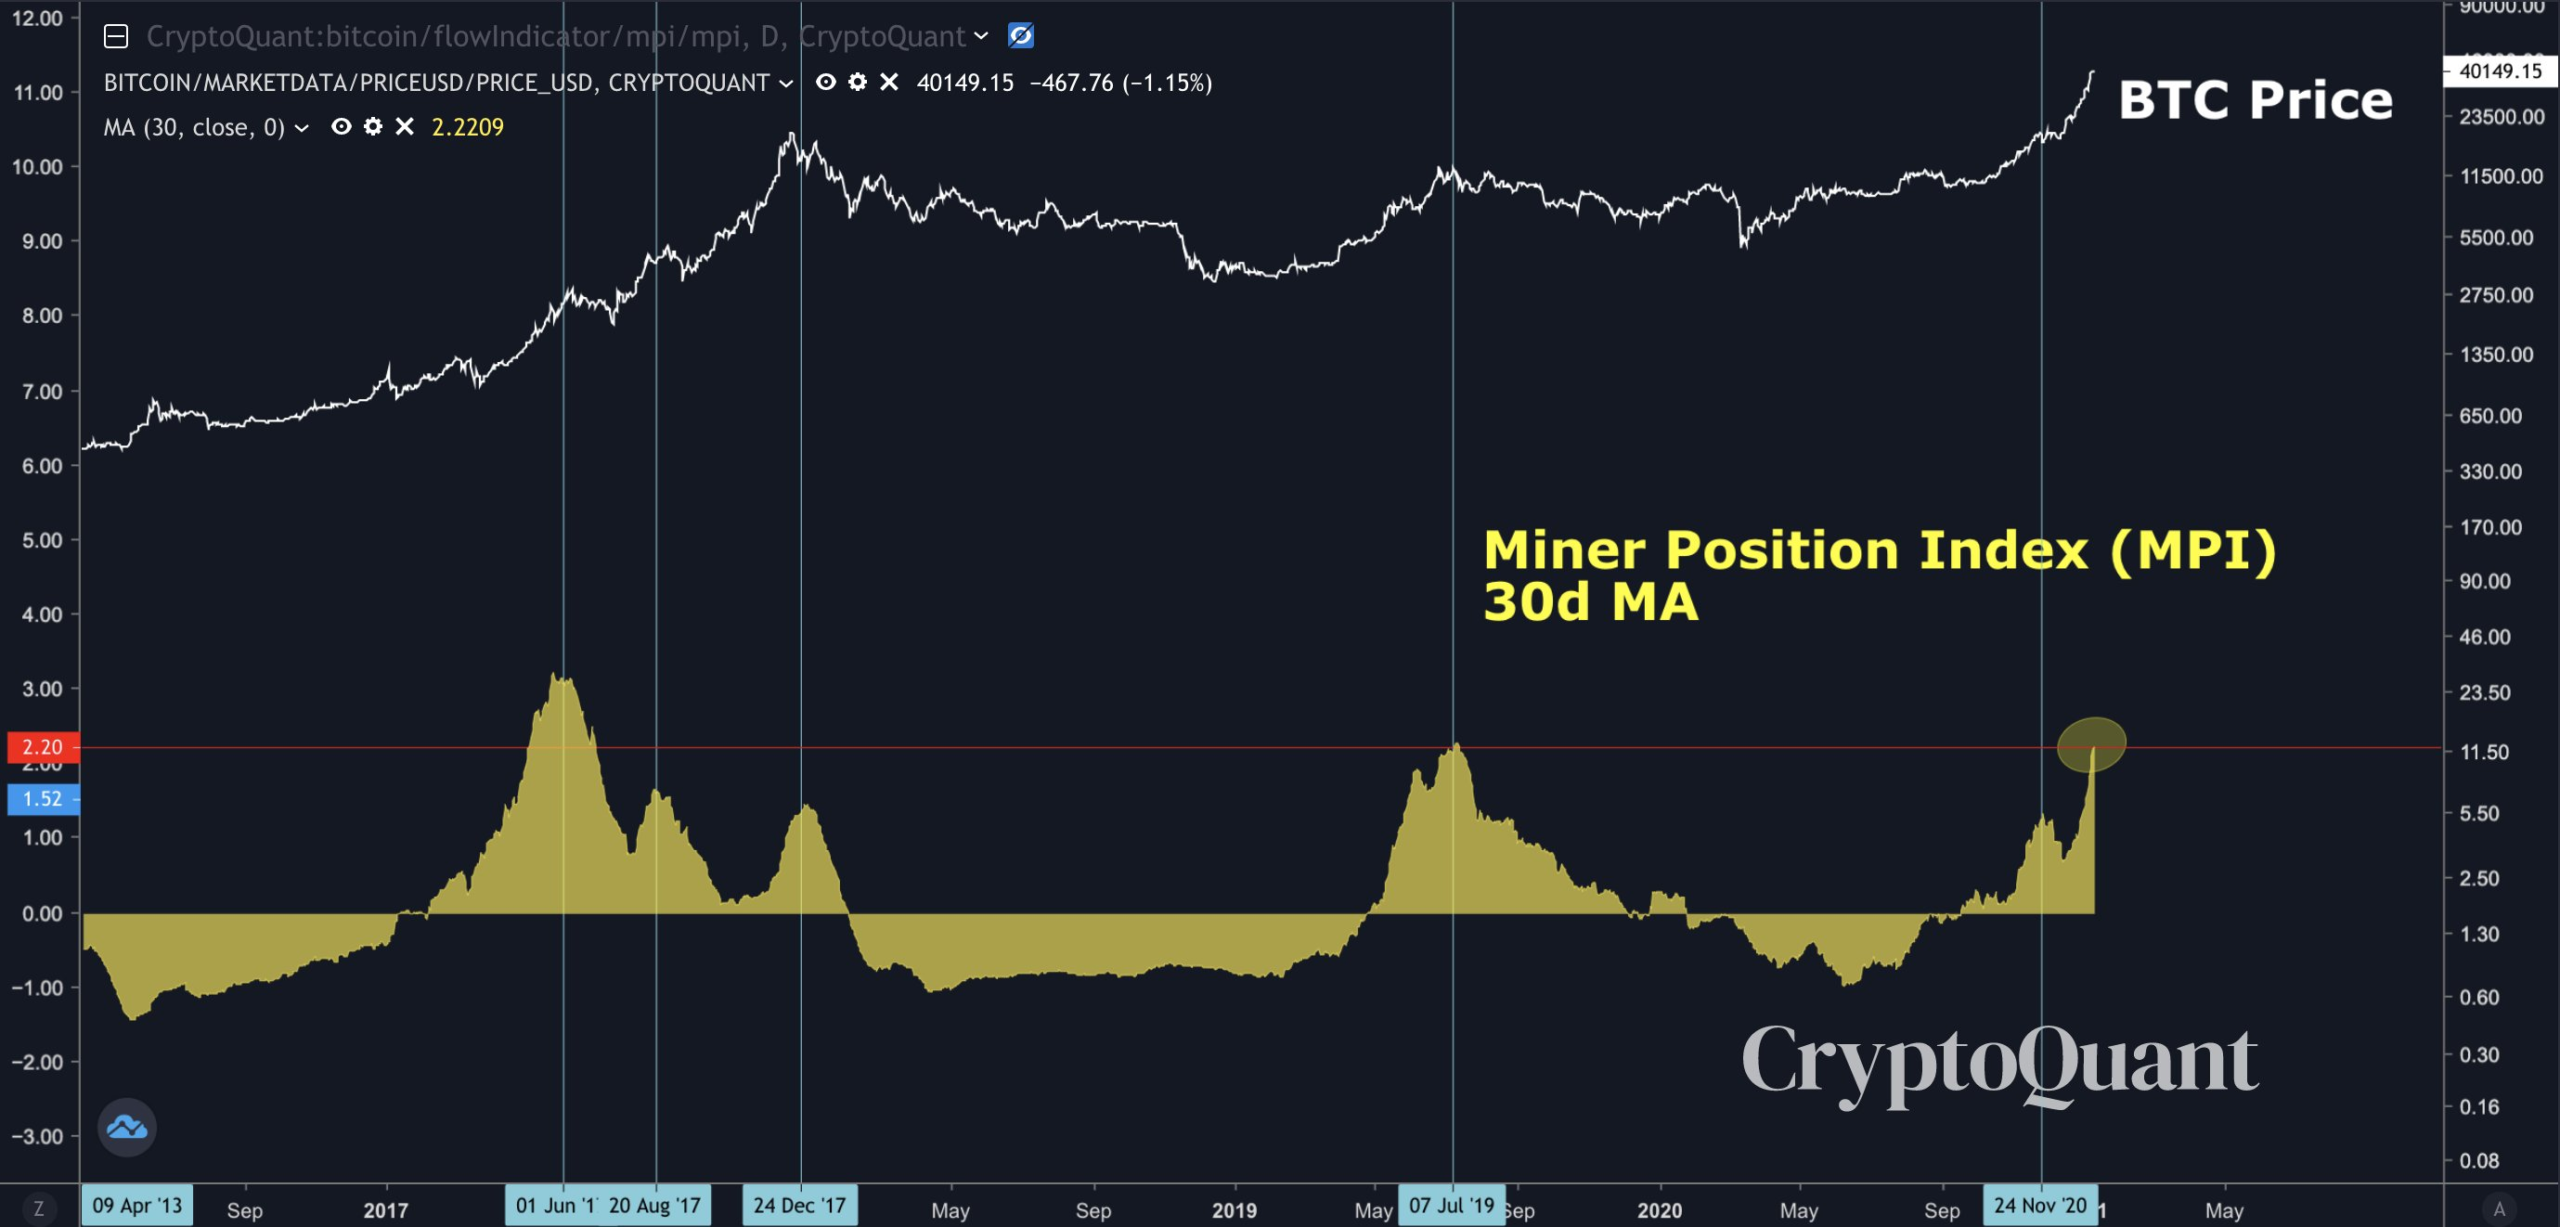
According to data from on-chain monitoring resource CryptoQuant, those sales have now reached their highest since July 2019, even surpassing those which followed the latest block subsidy halving in May last year.
CryptoQuant used its Miner Position Index (MPI) to determine miners’ decreasing stocks of BTC, with CEO Ki Young Ju describing the current situation as a “short-term bearish market.”
“Since December last year, they had been selling $BTC, but the correction was tiny due to institutional buying power,” he added in comments.
Bitcoin MPI 30-day moving average chart. Source: Ki Young Ju/ Twitter
Cointelegraph in-house analyst Joseph Young had further thoughts. For him, Bitcoin at its all-time highs of $42,000 came at the end of a period during which the market had just overexerted itself. A period of taking stock — perhaps literally — was more than necessary.
“$2.7 billion was liquidated today,” he noted on Monday.
“Simple answer is the market was overleveraged, got greedy, continue to buy first dips below $39k.”
No “altseason 2.0” just yet
Bitcoin’s lower levels may end up being a gift to altcoin hodlers, who have eagerly awaited a lessening of the bull run’s intensity to allow other tokens breathing space.
As Cointelegraph’s Van de Poppe often notes, altcoins do not do well during parabolic episodes in Bitcoin, with their main performance occurring after Bitcoin has cooled down.
“The #altcoin market capitalization still looks great,” he commented on Monday.
“The first level of the impulse wave was hit at $320 billion. As long as it remains above $225 billion, then the next run will bring the #altcoin capitalization towards new all-time highs.”
On Monday, however, it was clear that that pattern had yet to play out, with altcoins following Bitcoin downwards and even outpacing its losses.
Out of the top ten cryptocurrencies by market cap, many lost between 17% and 20% on the day, market leader Ether (ETH) nearing $1,000 support. Despite the drawdowns, many still retained solid gains on longer timeframes. In the case of the top ten, it was Cardano (ADA) in the lead overall, still up 27% versus a week ago.